Long-range forecasting and scenarios
Plan › Long-range projects net worth year by year to the end of your plan from your accounts, income, expenses and life events, and compares two scenarios side by side.
Updated September 5, 2026 · 2 min read
Long-range answers the question the monthly view cannot: where does this lead? It runs your accounts, income, expenses, debts and the mortgage forward one year at a time to an end age you choose, and lets you drop life events on the timeline to see what they do.
Setup
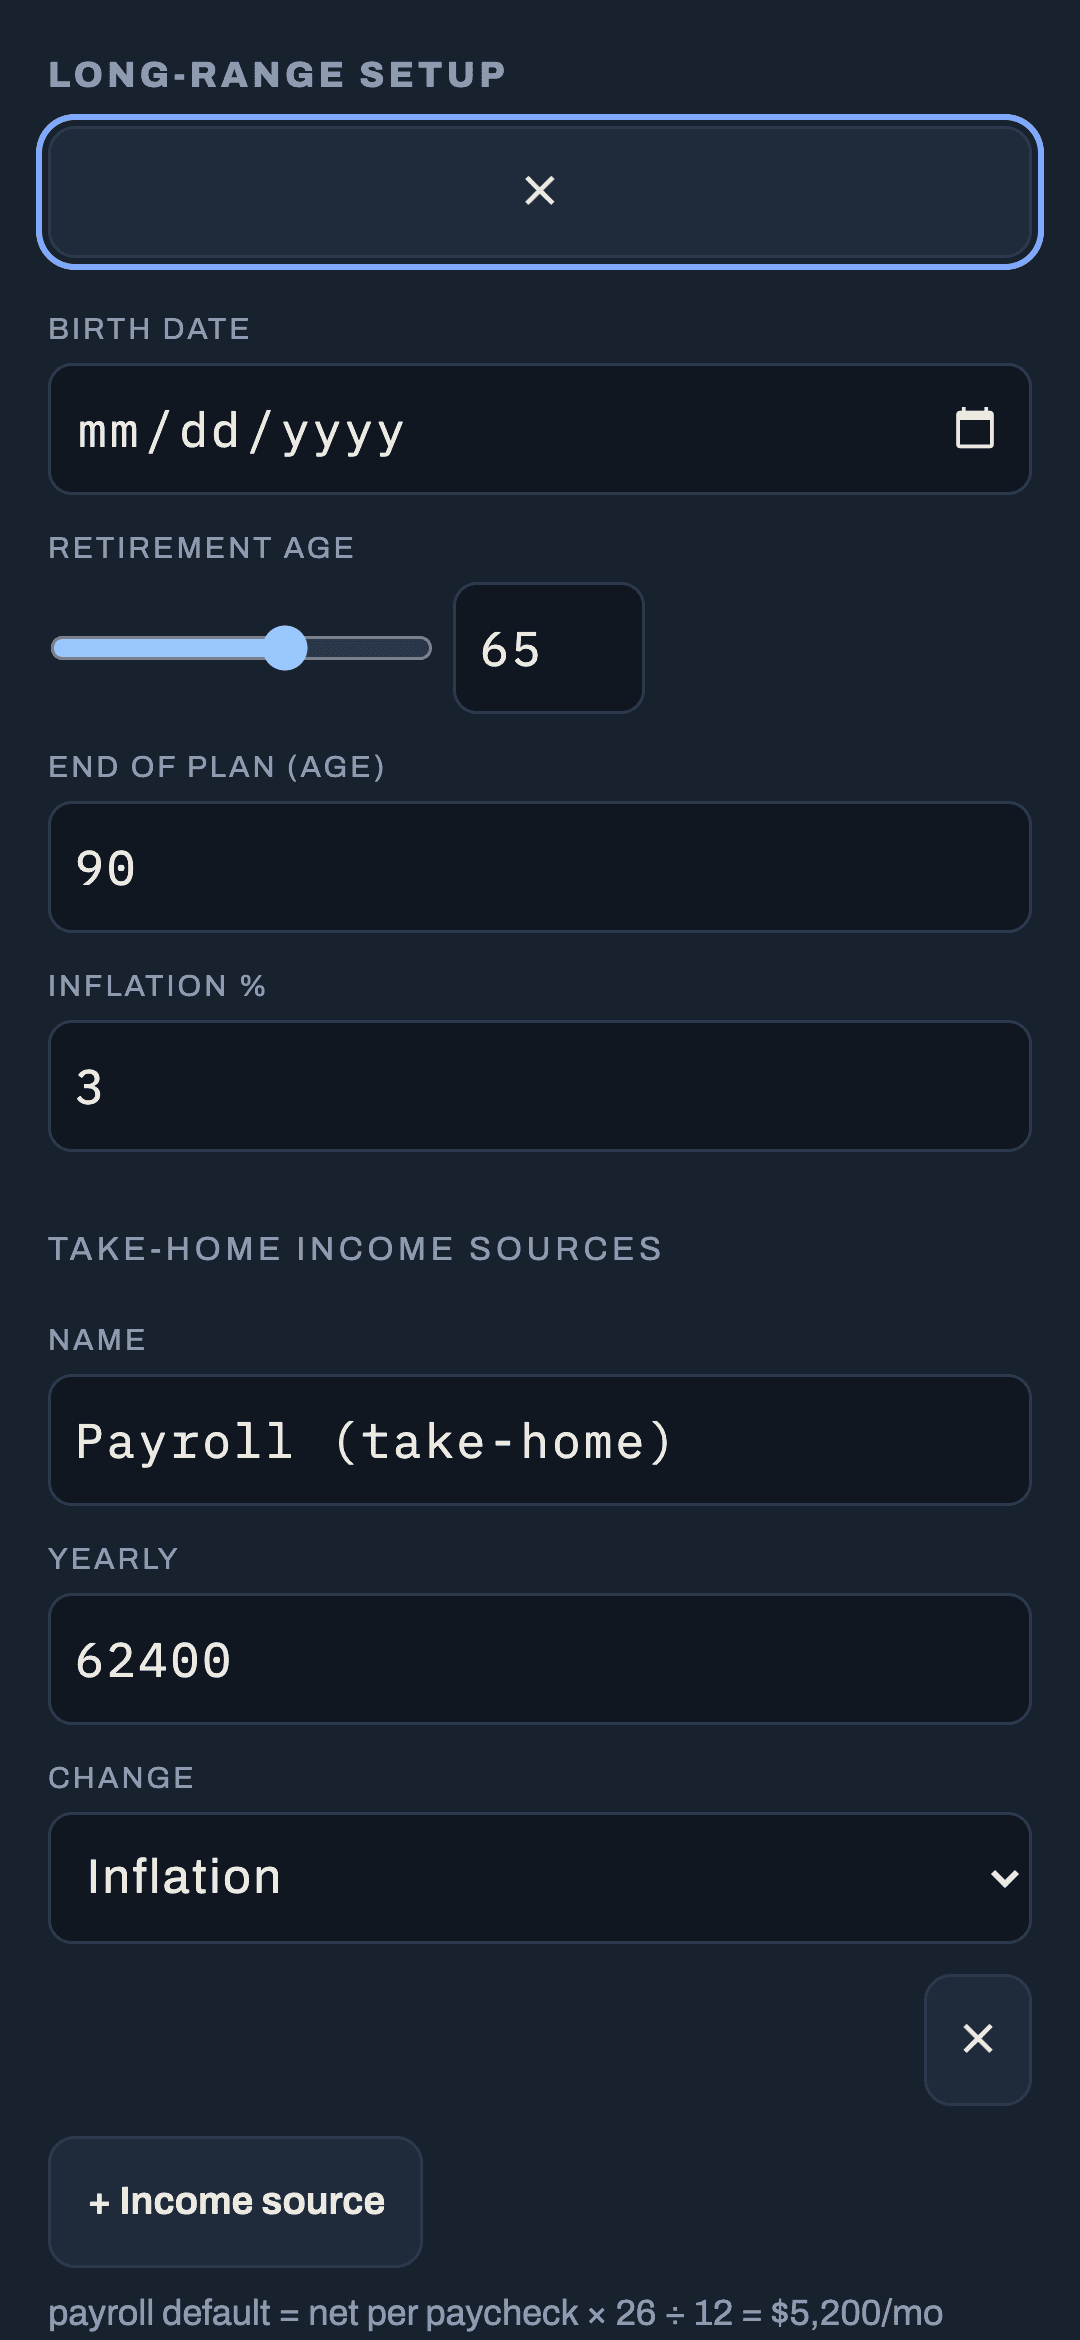
The first visit opens a setup drawer; you can reopen it from Setup:
- Birth date, retirement age (slider and field), end-of-plan age (default 90).
- Take-home income sources. Payroll is seeded at net per paycheck × 26 ÷ 12 per month, editable; add others. Each can change over time (match inflation, +N%, −N%, fixed).
- Living-expenses baseline. Last twelve months of actuals, annualized from the months with data, or a number you type.
- Inflation (default 3%) and whether to show today's dollars or future dollars.
Accounts and assumptions
Every asset has an include toggle, a growth rate with a default by type (checking 0%, savings 2% or the account's own rate, investments 7%, real estate the home appreciation setting, vehicles −15%), a tax type, and an optional schedule ("from year N use X%"). Liabilities come from Debts with their APR and payment; cards paid in full are excluded by default. Surplus goes to extra savings at 3% or is split across accounts by percent or dollars; shortfalls are withdrawn in an order you can edit, grossed up for tax.
The engine, in one paragraph
Each year: income − expenses − debt payments − goal contributions = surplus. Surplus is saved; shortfalls are withdrawn. A paid-off debt frees its payment. The mortgage runs monthly inside the year with biweekly halves and the two extra halves to principal, and PMI drops at 80% first-lien loan-to-value or the date you set. The current year is prorated from today.
Life events
Add from the button or by tapping the chart: Retirement (age, % of expenses, income reduction), Social Security (start age, monthly), Buy a home, Sell current home, New job / raise, Career break, Other income and Other expense (one-time or recurring). Each has a color and a chip on the timeline you can drag along the years; the plan re-runs as you drag.
Scenarios
The scenario pills at the top are the same scenarios the monthly projection uses. Save as copies the current assumptions and events under a name; Compare overlays a second scenario on the chart with the difference on each stat: net worth at end of year, at retirement, retirement age, at the end of the plan. Retire at 60 versus 65 is the classic first comparison.
Tables
Accounts (end balance per account per year; expand for deposits, growth, withdrawals), Cash flow (income sources, expenses, debt payments, contributions, net, withdrawals with tax), Events (chronological, tap to edit or remove). A three-year window with ‹ › on phones.
A directional projection, not a prediction
The ⓘ on the page title says it plainly: this is arithmetic on assumptions you can see and change. Growth rates, inflation and your own future are not known. Use it to compare choices, not to read the future.
More in Plan
Still stuck?
Tell us what you were trying to do and what happened. A person reads every message.
Contact support